Unlocking the Power of QuickBooks Online Reports: A Deep Dive for Bookkeepers and Business Owners
Let’s face it, we all love those satisfying “cha-chings” as payments hit our bank accounts. But as bookkeepers and business owners, we know that the true story of our financial health lies deeper, within the reports nestled inside QuickBooks Online (QBO).
It’s easy to get lost in the sea of numbers, but knowing how to navigate and manipulate these reports is key to making informed business decisions. Think of it as having a superpower – the ability to see the trends, the profit powerhouses, and the potential pitfalls hidden within your data.
The QuickBooks Online Reports Landscape: A Quick Tour
First things first, understanding the layout of QBO’s reporting system is crucial. Depending on your QBO version (Simple Start, Essentials, Plus, or Advanced), you’ll have access to a varying number of reports, each tailored to specific features.
You can access reports through various avenues:
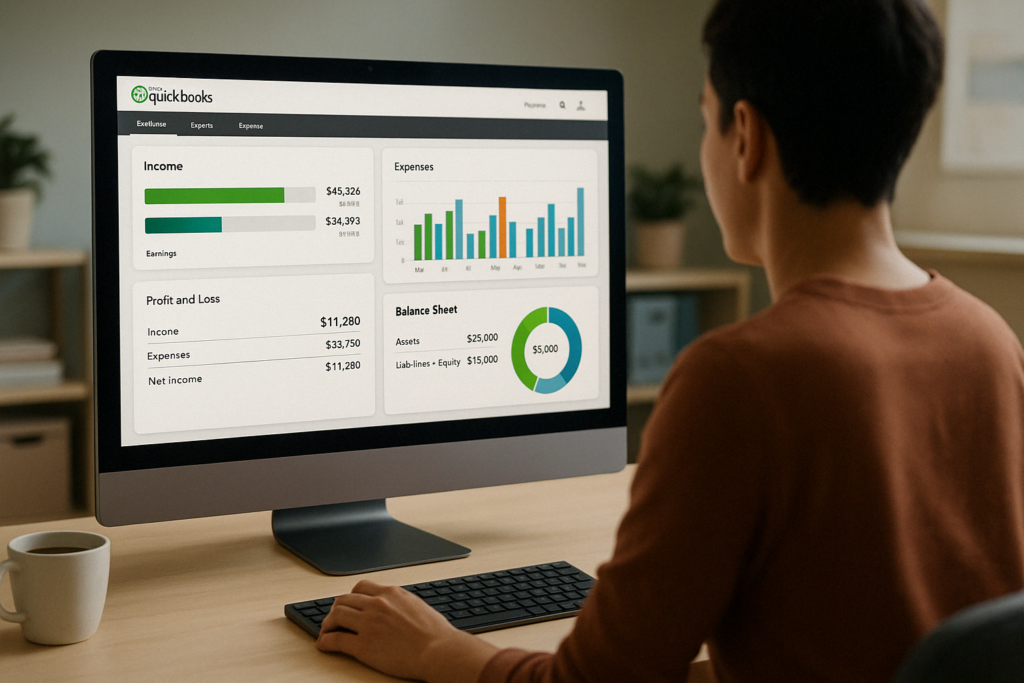
- Dashboards: Interactive charts providing a visual snapshot of your financials.
- Money Bars: Handy filters in the customer and vendor centers, allowing you to quickly isolate specific types of transactions.
- Quick Reports: Conveniently accessed from transaction and item lists, offering a focused report on the selected item or transaction.
- Transaction Journal: Reveals the double-entry accounting behind every transaction, showing you the debits and credits (sources and targets) involved.
- Reports Center: The heart of QBO reporting, housing all reports categorized by type, with search functionality, favorites, and custom report options.
Cash vs. Accrual: Two Sides of the Financial Coin
Before we dive into report customization, let’s address a fundamental concept: cash vs. accrual accounting.
- Cash Basis: Records income when received and expenses when paid.
- Accrual Basis: Recognizes income when invoiced and expenses when bills are incurred, regardless of payment timing.
While most small businesses operate on a cash basis for taxes, understanding your financial picture from both angles is essential. QBO allows you to toggle between cash and accrual reporting, giving you a complete view of your financial performance.
Essential Reports Every Business Owner Should Know
Now, let’s explore the reports that provide vital insights for managing your business:
- Profit and Loss (P&L): This report is your financial scorecard. It summarizes income, cost of goods sold, expenses, and ultimately, your net income (profit or loss) over a specific period. It’s crucial for understanding your overall profitability.
- Balance Sheet: A snapshot of your financial health at a given point in time. It outlines your assets (what you own), liabilities (what you owe), and equity (your ownership in the business). Understanding this relationship is essential for managing your company’s financial stability.
- Cash Flow Statement: Your cash flow statement is the bridge between your P&L and balance sheet. It explains the movement of cash in and out of your business, providing insights into your liquidity and ability to meet financial obligations.
Beyond the Basics: Power Up Your Reporting
QBO offers a wealth of reports for deeper analysis. Let’s highlight a few favorites:
- Accounts Receivable (AR) Aging Summary: Shows you who owes you money and how long overdue they are, helping you manage collections and cash flow.
- Accounts Payable (AP) Aging Summary: Provides the same insight into your outstanding bills, ensuring timely payments and avoiding late fees.
- Income by Customer Summary: Reveals your profit margin per customer, allowing you to identify your most valuable clients and tailor your services accordingly.
- Sales by Product/Service Summary: Analyzes sales performance by product or service, including quantity sold, revenue generated, and average price, helping you identify your top performers and adjust your offerings accordingly.
Customizing QuickBooks Online Reports: Making QBO Work for You
Here’s where the real magic happens. QBO allows you to tailor reports to meet your specific needs.
You can:
- Customize Columns: Choose the data points most relevant to your analysis.
- Filter Data: Isolate specific information based on customer, product, date, and more.
- Compare Periods: Track changes over time by comparing data from different periods.
- Collapse and Expand Sections: Focus on specific areas of your report for clearer analysis.
- Sort Data: Arrange information in descending or ascending order for quicker insights.
- Format Numbers: Control how numbers are displayed for easier readability.
- Save Customizations: Create your own personalized reports for future use.
QuickBooks Online Advanced: Reporting on Steroids
If you’re ready to take your reporting to the next level, QBO Advanced offers a suite of powerful tools.
- Performance Center: Provides interactive charts tailored to your industry, offering valuable insights into your key performance indicators (KPIs) and benchmarks.
- Custom Report Builder: Lets you create incredibly detailed reports by combining data from various tables, enabling multidimensional analysis and even pivot tables and charts.
- Custom Fields: Add unique data points to customers, vendors, and transactions, unlocking even more granular reporting and analysis.
- Spreadsheet Sync: Seamlessly integrates with Excel for advanced reporting, including consolidated reporting across multiple QBO files, live data updates, and custom templates.
Harnessing the Power of QuickBooks Online Reports: A Call to Action
By now, you’ve witnessed the vast potential of QBO reports. They’re not just static numbers, but powerful tools that can guide your business decisions and fuel your growth.
Ready to unlock this superpower and master the art of running reports in QuickBooks Online? Click here to enroll in our comprehensive online course, “Running Reports in QuickBooks Online,” and take control of your financial destiny.